
Measured Change Roofing Case Study
A simulated roofing case study showing how a bounded pilot exposed an ownership gap and supported careful stabilization and expansion.
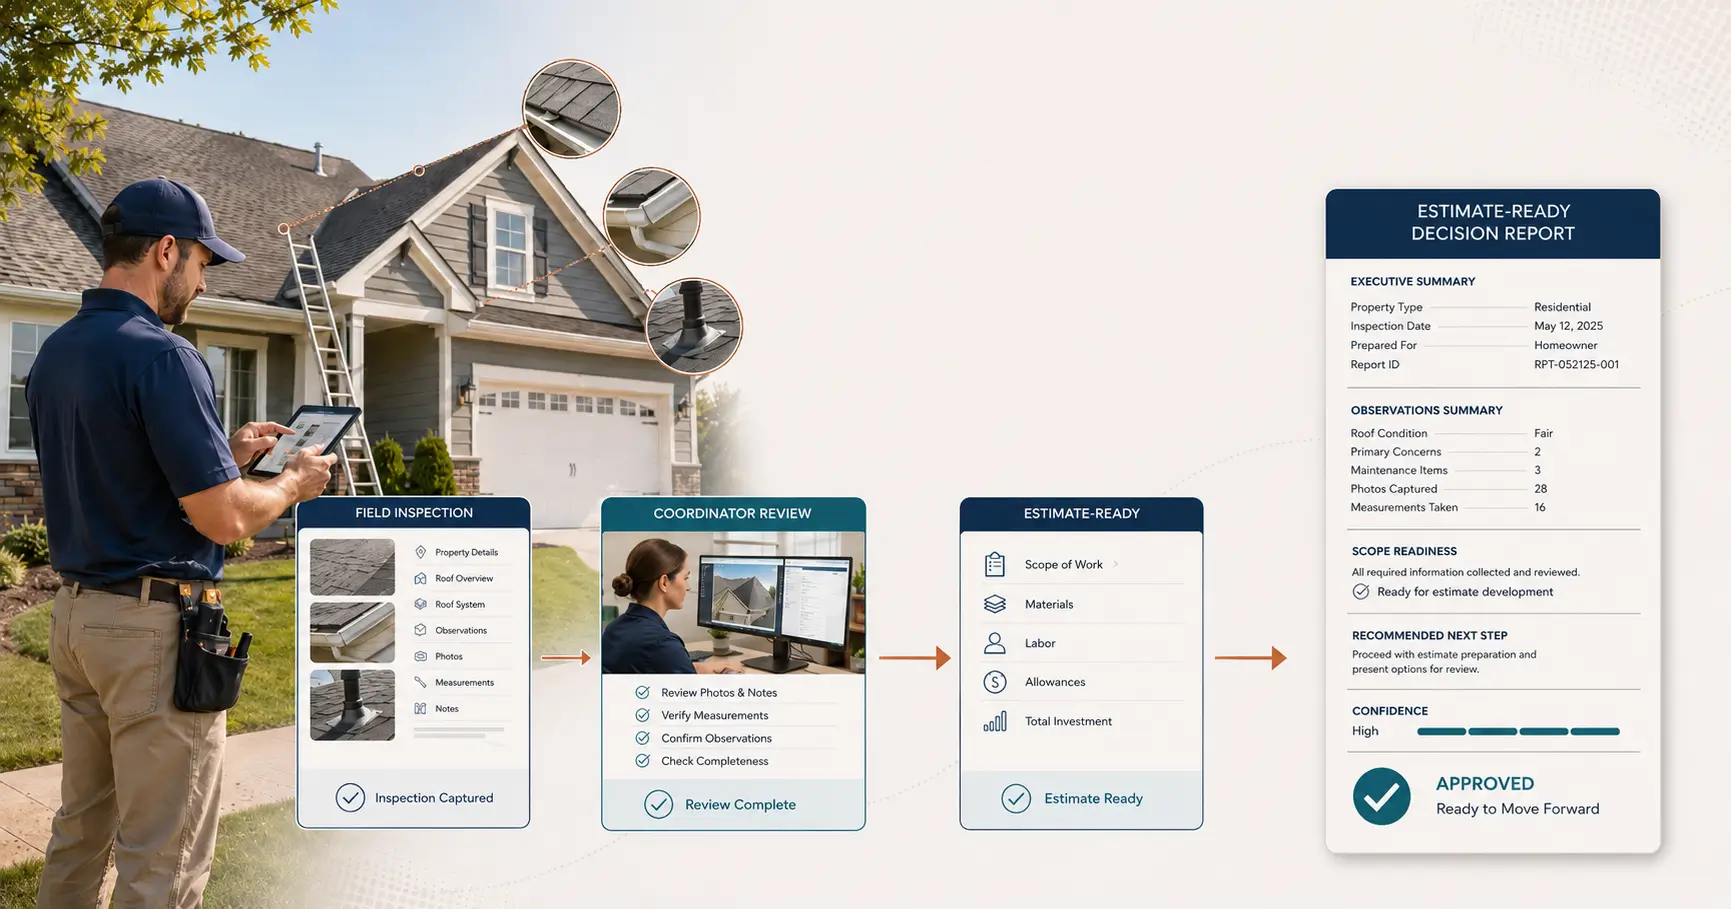
Simulated case study: This scenario uses synthetic business data created to demonstrate the Measured Change Strategy and Toolkit. It does not describe a client engagement. The names, costs, measurements, and operational details are illustrative.
From Roof Inspection to Estimate-Ready: Testing a Workflow Before Scaling It
A completed roof inspection should give an estimator what they need to prepare an estimate. In practice, the information may be scattered across a mobile form, a shared drive, text messages, and individual memory.
That was the problem examined in this simulated roofing-company scenario.
The company did not begin by purchasing another system or automating the entire estimating process. It used the six-stage Measured Change Strategy, consisting of Observe, Map, Pilot, Measure, Adjust, and Stabilize, to test one bounded workflow and evaluate the evidence before expanding it.
The result was not simply a faster process. The exercise revealed an ownership gap, tested a focused operational change, recorded its costs and limits, and produced a decision report the team could review, sign, and revisit.
The workflow question
The workflow began when a residential roof inspection was complete and ended when the inspection information was ready for an estimator.
Technicians already used a mobile form and uploaded photographs. However, missing details were often sent separately by text. The estimator searched across these sources, reconstructed the scope, and requested clarification when access conditions, customer priorities, or other facts were unclear.
During a 12-day baseline observation period, the simulated team recorded:
| Baseline measure | Result |
|---|---|
| Packets observed | 40 |
| Average staff time per packet | 52 minutes |
| Packets requiring rework | 12 |
| Average rework time | 20 minutes |
| Estimates issued within two business days | 24 of 40 |
The numbers showed delay and rework, but they did not explain why the work stalled. That required mapping how the handoff actually occurred.
Mapping revealed a decision with no owner
The workflow map documented seven steps, three handoffs, three stall points, and one ownership gap.
The most consequential gap appeared between uploading the inspection record and beginning the estimate:
No one consistently owned the decision that an inspection packet was estimate-ready.
Without a clear readiness owner, the estimator became the person who discovered missing information. Requests were usually sent by text and were not centrally visible. By the time a request arrived, the technician might already be working through another full day of appointments, which delayed the correction.
The map changed the problem definition. The issue was not only an incomplete form. It was also an unclear decision and an unmanaged exception path.
The central bottleneck was not a lack of estimating software. It was a field-to-office handoff with no one accountable for deciding when a packet was ready.
A bounded pilot tested the handoff
The team designed a 12-day pilot using:
- A standard inspection packet, with additional form fields
- A coordinator-owned exception queue
- Two scheduled coordinator exception reviews each day, at 11:00 AM and 3:30 PM
- Existing forms and shared-drive tools
- Six hours of form setup and two hours of training
- Explicit success criteria agreed upon before the test
The pilot was intentionally narrow. It included routine, owner-occupied residential asphalt-shingle projects estimated below $40,000 with normal access conditions.
It excluded insurance supplements, active leak emergencies, commercial roofs, solar removal, structural engineering, and specialty materials. Those exclusions matter. Evidence from a routine residential workflow cannot automatically support decisions about more complex work.
What the pilot measured
Twenty packets were measured during the pilot.
| Metric | Baseline | Pilot result |
|---|---|---|
| Staff minutes per packet | 52 | 34 |
| Rework incidents per 20 packets | 6 | 2 |
| Rework minutes per incident | 20 | 10 |
| Estimate-ready on first review | 55% | 90% |
| Estimates issued within two business days | 60% | 85% |
The baseline rework figure was normalized to the pilot’s 20-packet sample. The 12 rework packets recorded across 40 baseline packets represent the same 30 percent rate as 6 across 20.
The pilot met every numeric target. For routine inspection facts, the estimator no longer had to search text-message threads.
The test also produced a more useful finding. The twice-daily exception review appeared to matter more than adding fields to the form. The operational rhythm and assigned responsibility helped the team act on incomplete packets.
The first result was useful, but not perfect
The pilot introduced new friction. Two technicians selected “other” for an access constraint without explaining the condition.
Complicated customer-financing questions also continued to require review by the company owner. Rather than treating that fact as a failed result, the report kept financing decisions outside the workflow conclusion.
The financial record preserved another important distinction. The 20-packet pilot produced an estimated $322 in measured operational benefit. After the initial implementation investment and the pilot period’s recurring cost were included, the measured pilot net value remained negative at $769.
The longer-term projection became favorable only if the measured improvement and expected volume continued.
| Financial measure | Recorded result |
|---|---|
| Implementation investment | $1,056 |
| Recurring cost during pilot | $35 |
| Total cost incurred | $1,091 |
| Measured operational benefit | $322 |
| Measured pilot net value | -$769 |
| Projected monthly net benefit | $1,200 |
| Projected payback period | 0.9 months |
| Projected first-year net value | $13,344 |
The report retains its formal financial labels. In practical terms, the modeled benefit represents labor capacity created by reducing handling and rework time. It does not guarantee payroll reductions, additional revenue, or cash savings.
These projections are estimates, not promised returns. They depend on the entered labor rate, monthly volume, implementation cost, recurring cost, and continued performance of the changed workflow.
That distinction is central to the Measured Change Strategy. A pilot can produce encouraging evidence without pretending that a projection has already been earned.
Adjustment closed the most important gap
The team made two focused adjustments:
- Require a plain-language explanation whenever a technician selects “other.”
- Assign responsibility for returning and clearing incomplete packets to the project coordinator.
During a 10-packet extension, average staff effort fell to 33 minutes. All 10 packets passed first review, and nine estimates were issued within two business days. The remaining estimate required a customer-financing decision, which was already kept outside the workflow conclusion.
This second cycle mattered because it tested the response to the pilot’s friction rather than declaring success after the first favorable numbers.
Stabilization required a handoff test
A workflow is not stable merely because the person who designed it can make it work.
To test whether the procedure could travel, a second coordinator processed five inspection packets from the written instructions without verbal coaching. The test uncovered one missing instruction: how to classify a financing hold.
The procedure was updated to treat that situation as a customer-dependent exception rather than an internal delay.
Only then was the workflow documented, assigned an owner, approved for continued use, and marked Stabilized for comparable residential inspections.
The report records the next decision as Scale, but only within the tested boundary. The company would use the procedure for 60 days, continue measuring first-review readiness and turnaround, and avoid extending the findings to excluded roofing categories without separate observation.
What the report preserves
The full Measured Change Strategy report brings the working record into one document:
- The observed workflow and baseline evidence
- The process map, handoffs, stall points, and ownership gap
- The pilot scope, exclusions, owner, dates, and success criteria
- Baseline-to-pilot measurements
- Implementation, transition, recurring, and labor costs
- Projected value, payback, and stated assumptions
- The evidence rating and how it was determined
- The Measure-stage decision record
- The adjustment cycle and additional findings
- The stabilized procedure, handoff test, next decision, and approval record
This makes the report more than a summary of answers entered into a questionnaire. It is a point-in-time record of what the team observed, what it tested, what it learned, and what it decided not to claim.
View the simulated full report (PDF)
What this simulated case demonstrates
This scenario does not prove that every roofing contractor will create the same labor-capacity value. It illustrates how a small business can evaluate one workflow without beginning with a large software commitment.
The main lesson is practical:
A workflow change becomes easier to evaluate when the team separates measured pilot evidence from projected value, documents exceptions, and limits the final decision to the work actually tested.
The Measured Change Toolkit is a browser-based companion for applying this process. The free Toolkit guides users through the six stages. A structured PDF report can then preserve the evidence, assumptions, decisions, and approval record for formal review.